
Notes from Getting on the Hacker News Front Page
My first Hacker News front page at last
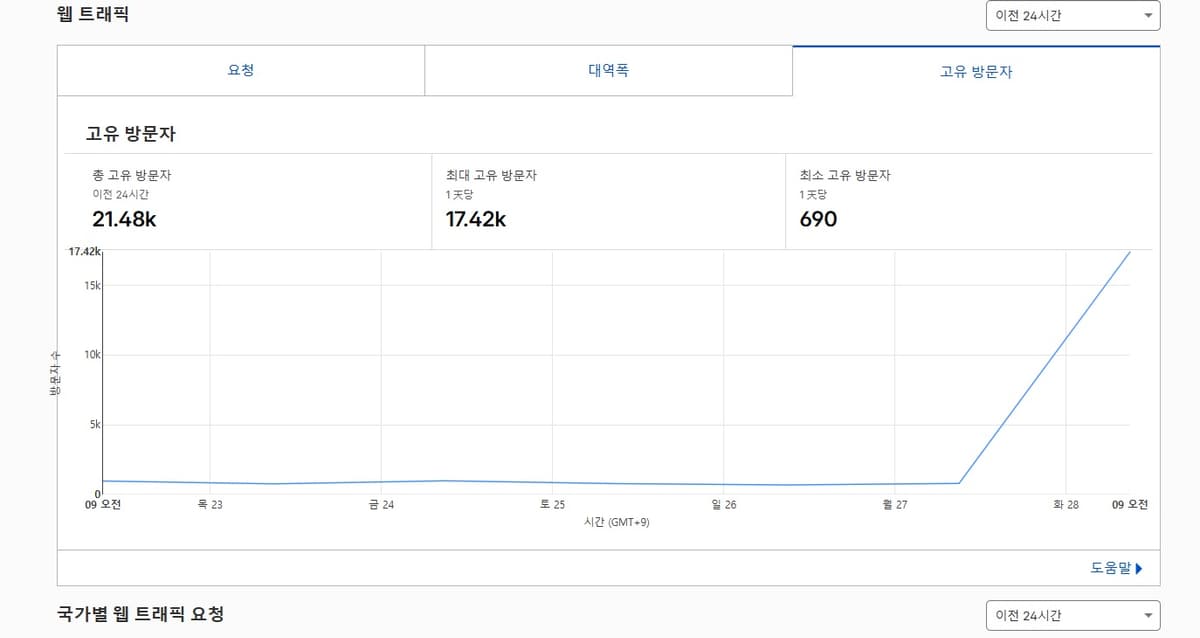
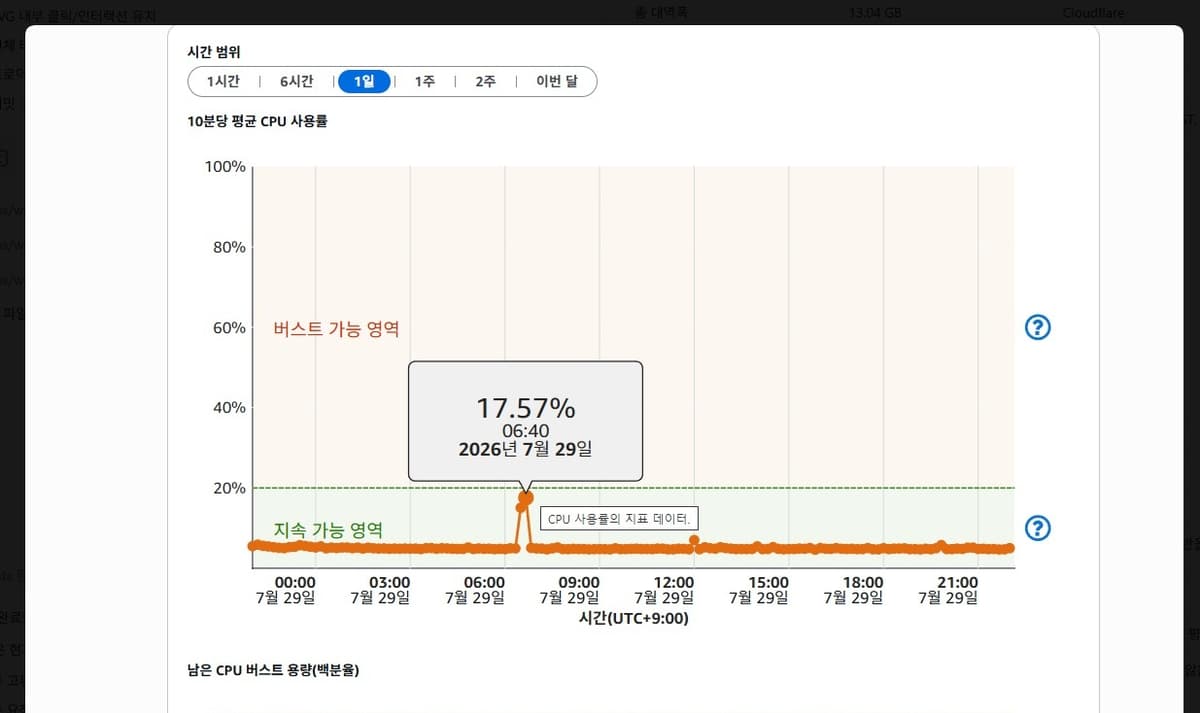
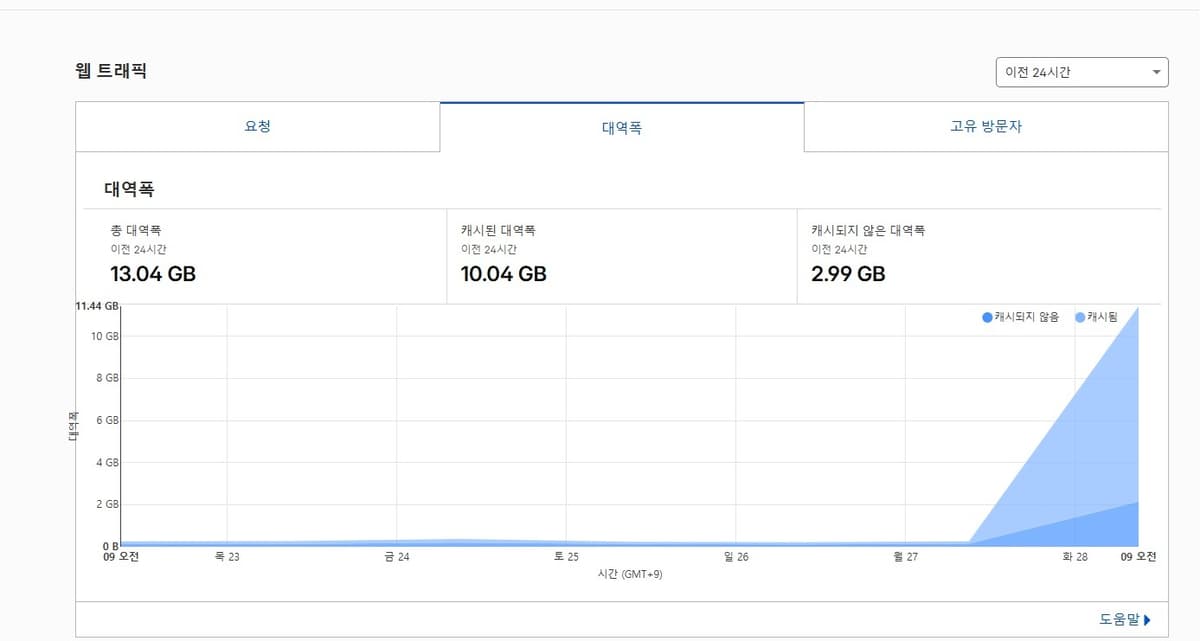
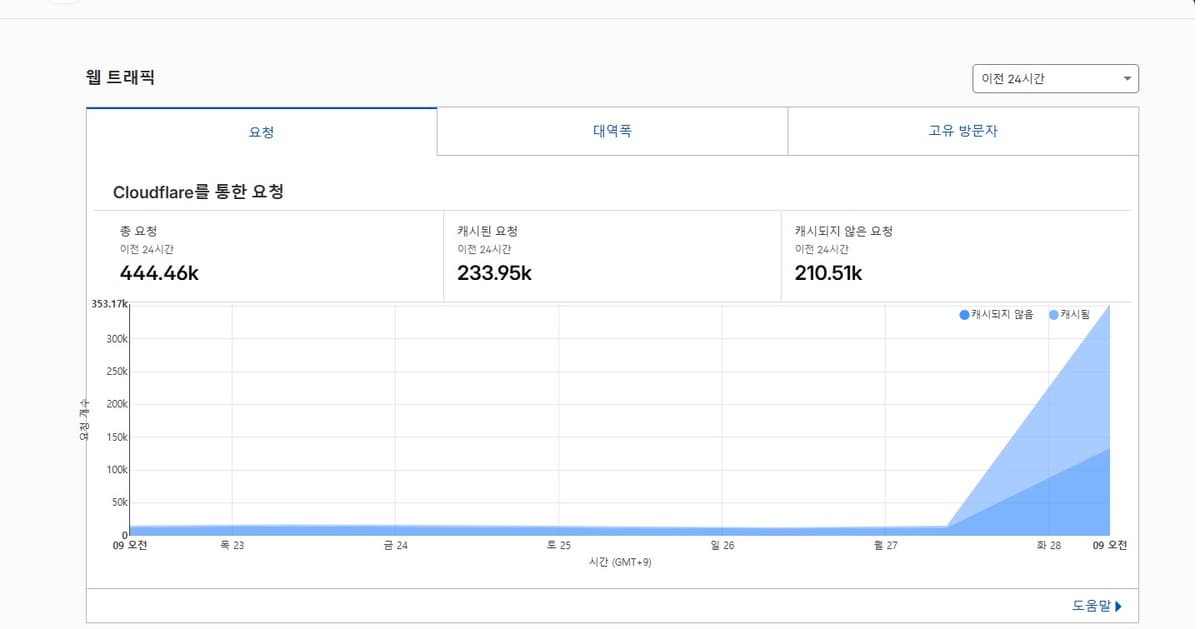

Status: Observed L1 (Level 1) Peak Baseline | Event: Hacker News Front Page Exposure | Observation Screenshot Date: 2026-07-29 (KST)
I want to record the operational baseline observed from actual public traffic this time. Given the nature of my site, which mostly covers programming-related topics, visitor counts tend to be low. Average daily visitors are around 600–900, and the daily average for June 2026 was approximately 637.
Going forward, I intend to treat the maximum inflow observed from Hacker News front-page exposure to date as the L1 Peak for the current service.
Deployment boundaries at the time
Browser
  -> Cloudflare (DNS, WAF, edge cache)
  -> Vercel / Next.js (public Web & Web BFF)
  -> Cloudflare api.makonea.com
  -> 4 GB Lightsail (Nginx, BFF, content/assets/RAG, PostgreSQL)
The Cloudflare Zone-wide metrics may include web requests handled by Vercel, requests intentionally bypassed such as RSC and prefetch, and api.makonea.com requests. Therefore, Cloudflare's "uncached" count should not be treated entirely as requests reaching the Lightsail origin.
Observed Values
Metric | Observed Value | Source and Aggregation Unit | Interpretation |
|---|---|---|---|
Estimated Total Unique Visitors | 21.48k | Cloudflare, displayed as | A Cloudflare aggregated value that does not equal the actual number of people or sessions |
Total Requests | 444.46k | Cloudflare, displayed as | Total request count across the entire Zone |
Cached Requests | 233.95k | Cloudflare, displayed as | Requests served from the Cloudflare cache |
Uncached Requests | 210.51k | Cloudflare, displayed as | Requests forwarded to the origin, though the origin is not necessarily Lightsail |
Total Bandwidth | 13.04 GB | Cloudflare, displayed as | Total data transferred through Cloudflare |
Cached Bandwidth | 10.04 GB | Cloudflare, displayed as | Data transferred via cached responses |
Uncached Bandwidth | 2.99 GB | Cloudflare, displayed as | Data transferred via origin responses |
Lightsail Peak CPU Average | 17.57% | 2026-07-29 06:40 KST, 10-minute average | Observed peak average value for the 4 GB Lightsail instance |
Lightsail CPU Burst Remaining | 100% | Lightsail 1-day graph | No meaningful burst capacity reduction observed at this measurement resolution |
- Metric
Estimated Total Unique Visitors
- Observed Value
21.48k
- Source and Aggregation Unit
Cloudflare, displayed as
Previous 24 hours- Interpretation
A Cloudflare aggregated value that does not equal the actual number of people or sessions
- Metric
Total Requests
- Observed Value
444.46k
- Source and Aggregation Unit
Cloudflare, displayed as
Previous 24 hours- Interpretation
Total request count across the entire Zone
- Metric
Cached Requests
- Observed Value
233.95k
- Source and Aggregation Unit
Cloudflare, displayed as
Previous 24 hours- Interpretation
Requests served from the Cloudflare cache
- Metric
Uncached Requests
- Observed Value
210.51k
- Source and Aggregation Unit
Cloudflare, displayed as
Previous 24 hours- Interpretation
Requests forwarded to the origin, though the origin is not necessarily Lightsail
- Metric
Total Bandwidth
- Observed Value
13.04 GB
- Source and Aggregation Unit
Cloudflare, displayed as
Previous 24 hours- Interpretation
Total data transferred through Cloudflare
- Metric
Cached Bandwidth
- Observed Value
10.04 GB
- Source and Aggregation Unit
Cloudflare, displayed as
Previous 24 hours- Interpretation
Data transferred via cached responses
- Metric
Uncached Bandwidth
- Observed Value
2.99 GB
- Source and Aggregation Unit
Cloudflare, displayed as
Previous 24 hours- Interpretation
Data transferred via origin responses
- Metric
Lightsail Peak CPU Average
- Observed Value
17.57%
- Source and Aggregation Unit
2026-07-29 06:40 KST, 10-minute average
- Interpretation
Observed peak average value for the 4 GB Lightsail instance
- Metric
Lightsail CPU Burst Remaining
- Observed Value
100%
- Source and Aggregation Unit
Lightsail 1-day graph
- Interpretation
No meaningful burst capacity reduction observed at this measurement resolution
UI Display Values for Reference Only
The values below are not used for capacity calculations because the selected range and display unit on the screen do not match.
Metric | Screen Display Value | Issue |
|---|---|---|
Maximum Unique Visitor Bucket | 17.42k | Selected range is |
Minimum Unique Visitor Bucket | 690 | Selected range is |
- Metric
Maximum Unique Visitor Bucket
- Screen Display Value
17.42k
- Issue
Selected range is
Previous 24 hours, but the unit is displayed asPer week
- Metric
Minimum Unique Visitor Bucket
- Screen Display Value
690
- Issue
Selected range is
Previous 24 hours, but the unit is displayed asPer week
The Cloudflare screen's selected range is Previous 24 hours, but the maximum and minimum values on the unique visitor graph are displayed in Per week units. Therefore, 17.42k and 690 should not be interpreted as hourly visitors, instantaneous concurrent users, or a clearly defined 24-hour aggregation bucket. Both values are preserved solely as reference UI display values from the screenshot and are excluded from capacity assessments and derived metric calculations.
Metric | Observed Value | Source and Unit |
|---|---|---|
Maximum Request Aggregation Bucket | 9.39k requests | 2026-07-28 23:30, aggregation bucket as displayed on screen |
Instantaneous Peak RPS |
| No data available at sub-minute resolution |
- Metric
Maximum Request Aggregation Bucket
- Observed Value
9.39k requests
- Source and Unit
2026-07-28 23:30, aggregation bucket as displayed on screen
- Metric
Instantaneous Peak RPS
- Observed Value
Unknown- Source and Unit
No data available at sub-minute resolution
The Cloudflare screen's selector is set to Previous 24 hours, but the horizontal axis and the maximum/minimum units on the unique visitor graph are displayed as Per week.
The total requests on the maximum request bucket screen show 132.15k, which does not match the 444.46k from the Zone-wide screen. Differences in hostname, filters, bot inclusion, analytics product, or query window may account for this discrepancy, so the two values should not be combined as if they represent the same population.
Because of this discrepancy, 17.42k is not reinterpreted as hourly visitors or instantaneous concurrent users, and the exact peak RPS and concurrent user count could not be determined from this data alone.
Derived Metrics
Metric | Calculated Value | Interpretation |
|---|---|---|
Cache Hit Ratio (by Request Count) | approx. 52.64% | 233.95k / 444.46k |
Cache Miss Ratio (by Request Count) | approx. 47.36% | 210.51k / 444.46k |
Cache Hit Ratio (by Bandwidth) | approx. 76.99% | 10.04 GB / 13.04 GB |
Cache Miss Ratio (by Bandwidth) | approx. 22.93% | 2.99 GB / 13.04 GB, rounding error present |
Requests per Visitor | approx. 20.69 | 444.46k / 21.48k |
24-Hour Average Request Rate | approx. 5.14 req/s | Period average, not peak RPS |
24-Hour Average Cache Miss Request Rate | approx. 2.44 req/s | Not equivalent to the origin RPS |
- Metric
Cache Hit Ratio (by Request Count)
- Calculated Value
approx. 52.64%
- Interpretation
233.95k / 444.46k
- Metric
Cache Miss Ratio (by Request Count)
- Calculated Value
approx. 47.36%
- Interpretation
210.51k / 444.46k
- Metric
Cache Hit Ratio (by Bandwidth)
- Calculated Value
approx. 76.99%
- Interpretation
10.04 GB / 13.04 GB
- Metric
Cache Miss Ratio (by Bandwidth)
- Calculated Value
approx. 22.93%
- Interpretation
2.99 GB / 13.04 GB, rounding error present
- Metric
Requests per Visitor
- Calculated Value
approx. 20.69
- Interpretation
444.46k / 21.48k
- Metric
24-Hour Average Request Rate
- Calculated Value
approx. 5.14 req/s
- Interpretation
Period average, not peak RPS
- Metric
24-Hour Average Cache Miss Request Rate
- Calculated Value
approx. 2.44 req/s
- Interpretation
Not equivalent to the origin RPS
Large-byte responses such as static assets were largely absorbed by the edge. The request-count cache hit ratio being lower than the bandwidth-based ratio appears consistent with a mix of small but intentionally uncached requests, such as RSC, prefetch, API, and auth/admin paths.
The exact cause appears to be Unknown until a breakdown by hostname, path, cache status, and content type is performed.
On Capacity Assessment
Conclusion
The current configuration is assessed as having withstood a short-term inflow at the scale of this L1 Peak.
During this event, the observable Cloudflare edge transport layer and the Lightsail CPU layer showed no explicit saturation signals while handling the L1-HN inflow.
Basis:
The 10-minute average CPU peak of 17.57% remained within Lightsail's sustainable 20% zone.
CPU burst remaining stayed at 100%, meaning no short-term CPU emergency headroom was consumed.
Approximately 77% of total data transfer was handled by the Cloudflare cache.
This observed data contains no signals of CPU saturation or burst credit exhaustion.
That said, the worst-case CPU point is only 2.43 percentage points below the sustainable threshold. This result therefore serves as evidence that no explicit saturation was seen in the Cloudflare edge and Lightsail CPU layers during an inflow of this scale, but it is not evidence that the same state would hold over a long period at twice the traffic volume. End-to-end service quality and repeatability still require additional verification of error rates, latency, memory, and database metrics. If traffic doubles and sustains, the system could enter the burst zone, so a separate load test or evidence from the next real-traffic event is needed.
That would probably require being on the Hacker News front page for an entire day; based on current data, the exposure lasted approximately 6 hours.
Metrics to Collect Without Fail at the Next Peak
The following metrics were not available this time.
4xx and 5xx error rates per Cloudflare, Vercel, and Lightsail
p50, p95, and p99 response times for public HTML and API endpoints
Lightsail memory, swap, disk I/O, and container restart/OOM counts
PostgreSQL connection pool wait times and slow queries
Cache miss request distribution by hostname, path, cache status, and content type
Peak RPS and concurrent request count at 1-minute or finer intervals
At the next Hacker News-scale inflow, at minimum all of the following conditions should be met together to consider the L1 Peak successfully passed again.
Status | Assessment Criteria |
|---|---|
Normal | Core path 5xx < 0.5%, API p95 < 1 s, no OOM/restart, CPU mostly below baseline, burst remaining stable |
Caution | CPU exceeds baseline for 15+ minutes with burst remaining decreasing, API p95 > 1 s, DB pool wait or slow query increasing |
Critical | 5xx ≥ 1%, CPU baseline breach and rapid burst depletion occurring together, DB timeout, OOM, or container restart occurring |
- Status
Normal
- Assessment Criteria
Core path 5xx < 0.5%, API p95 < 1 s, no OOM/restart, CPU mostly below baseline, burst remaining stable
- Status
Caution
- Assessment Criteria
CPU exceeds baseline for 15+ minutes with burst remaining decreasing, API p95 > 1 s, DB pool wait or slow query increasing
- Status
Critical
- Assessment Criteria
5xx ≥ 1%, CPU baseline breach and rapid burst depletion occurring together, DB timeout, OOM, or container restart occurring
The 5xx and latency thresholds are not values observed in this screenshot; they are operational alerts for evaluating the next peak. Once actual data accumulates, these thresholds should be adjusted to match the observed distribution.
Conclusion
The Hacker News front-page exposure was a rare real-world load event gained through running a personal site, and honestly it felt great.
After experiencing an incident in the past where an AWS billing error showed an abnormal charge of roughly 30 million KRW, I migrated to a Lightsail-centered setup where costs are easier to predict. The 2 GB instance lacked sufficient memory and operational headroom, but the current instance showed no clear saturation signals in CPU or burst capacity during this HN traffic event.
Within the current observation scope, I therefore consider the setup to have achieved operational stability worth the cost. That said, instance costs and specifications need to be re-confirmed against the AWS billing statement, and at the next peak I plan to collect not only CPU data but also error rates, latency, memory, and PostgreSQL metrics.
Hands-on experience with infrastructure load is hard to come by, and I am recording it here for that reason.